Appendix: Tables
TABLE 1-1
The Growth of National Government in El Salvador as Measured by Average Tenure of Presidential Incumbents, 1824–1979
| Period | Years | Number of Different Incumbents | Average Tenure in Office (years)a |
|---|---|---|---|
| Federation | 1824−1838 | 17 | .82 |
| Transition | 1838−1841 | 8 | .38 |
| Informal republic | 1841−1859 | 42 | .43 |
| Liberal republic | 1859−1898 | 22 | 1.77 |
| Oligarchic republic | 1898−1931 | 11 | 3.00 |
| Military Dominance: | |||
| Personalist rule | 1931−1948 | 8 | 2.13 |
| Institutional rule | 1948−1979 | 9 | 3.44 |
Source: Adapted from El Salvador, Casa Presidencial, El Salvador, 1974–1975 (San Salvador: Departamento de Relaciones Públicas, 1974).
a. Average number of years in power for each incumbent during the period.
TABLE 1-2
The Growth of Government and Successful Military Coups
| Period Considered | Successful Coups | Frequency (years)a |
|---|---|---|
| 1841–1866 | 42 | .62 |
| 1890–1915 | 3 | 8.67 |
| 1916–1941 | 1 | 26.00 |
| 1944–1961 | 5 | 3.60 |
| 1962–1979 | 1 | 18.00 |
| 1841–1979 | 52 | 2.67 |
Source: Adapted from Flores Pinel, “Golpe de Estado,” p. 892.
a. Number of years lapsed between successful coups during the period.
TABLE 2-1
Use of Private Credit in El Salvador, 1961–1975 (percentages)
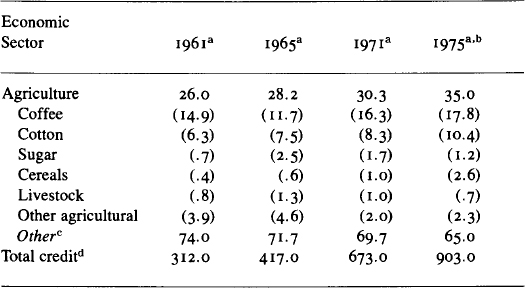
Source: Computed from Burke, “Sistema de Plantación,” p. 485, statistical appendix, chart 2 (from Banco Central de Reserva de El Salvador).
a. Includes credit by the Banco Hipotecario de El Salvador. Current prices, end-of-year balances.
b. Jan.–July only.
c. Includes industry, transportation, finance, retail and wholesale commerce, utilities, and services.
d. In millions of colones.
TABLE 2-2
Salaries of Coffee Workers in El Salvador for Selected Years, 1952–1980
| Crop Years | Colones per Daya |
|---|---|
| 1979–80 | 14.25 |
| 1978–79 | 9.75 |
| 1970–71 | 3.57 |
| 1965–66 | 2.55 |
| 1964b | 1.61 |
| 1952b | 1.57 |
Source: Latin America Commodities Report, CR-79-03a, 7 December 1979, p. 4; and Daniel and Ester Slutzky, “Estructura de la Explotación,” p. 105.
a. Colones in current prices.
b. One colón = US$ 0.40.
TABLE 2-3
Sources of Income of the Majority of Families in the Agricultural Sector in El Salvador, 1975
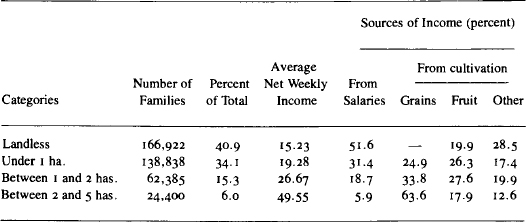
Source: Computed from Burke, “Sistema de Plantación,” pp. 476, 479 (from United Nations, undp/otc, 1976, charts 5, 12, and 18).
Note: Salary figures in colones, at current prices. One hectare is equal to 2.471 acres.
TABLE 3-1
Contemporary Presidential Races in El Salvador
| Year | Government | Opposition |
|---|---|---|
| 1950 | PRUD: Oscar Osorio (57%) | PAR: José A. Menéndez (43%) |
| 1956 | PRUD: José M. Lemus (94%) | PAR: Enrique Magaña (3%) |
| PAC: Rafael Carranza (3%) | ||
| PAN: Roberto E. Canessa (dq.) | ||
| PDN: José A. Diaz (dq.) | ||
| 1962 | PCN: Julio A. Rivera (92%) | blank ballots (8%) |
| 1967 | PCN: Fidel Sánchez (54%) | PDC: Abraham Rodriguez (22%) |
| PAR: Fabio Castillo (14%) | ||
| PPS: Alvaro Martínez (10%) | ||
| 1972a | PCN: Arturo Molina 334,600 | UNO: José A. Duarte 324,756 |
| FUDI: José A. Medrano 94,367 | ||
| PPS: José A. Rodríguez Porth 16,871 | ||
| 1977 | PCN: Carlos H. Romero 812,281 | UNO: Ernesto Claramount 394,661 |
Source: 1950–67: Mario Monteforte Toledo, Centroamérica, 2:78–80; 1972–77: Stephen Webre, José Napoleón Duarte, pp. 171–72.
Note: The UNO was a coalition composed of the PDC, the MNR, and the UDN.
a. Official results. According to the UNO the results were PCN: 317,535; UNO: 326,968.
TABLE 4-1
Political Violence in El Salvador, 1972–1979
| Administration | |||
|---|---|---|---|
| Categories | Molina | Romero | |
| Initiated by government: | |||
| Political assassinations | 37 | 461 | |
| Wounded by security forces | 78 | 88 | |
| Prosecuted for political offenses | 113 | 477 | |
| “Disappeared” | 69 | 131 | |
| Other terrorist acts | 9 | 15 | |
| Priests killed | 2 | 4 | |
| Initiated by the guerrillas: | |||
| Attacks | 31 | 60 | |
| Killings of security personnel | 24 | 58 | |
| Killings of paramilitary personnel | 18 | 74 | |
| Wounded in guerrilla attacks | 11 | 14 | |
| Kidnappings | 8 | 16 | |
Source: López Vallecillos, “Rasgos Sociales,” p. 871.
TABLE 7-1
Estimates of the Number of Victims of Government and Rightist Violence from January through September 1981
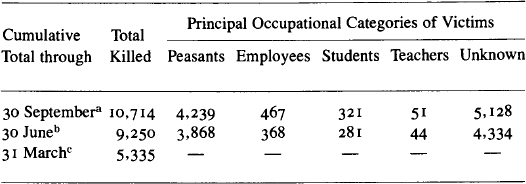
Source: SALPRESS weekly news summaries as follows:
a. with data from Socorro Jurídico release of 3 November 1981.
b. with data from Solidaridad, issue of 12 July 1981.
c. Miami Herald, 26 April 1981, p. 18C; no breakdown reported.
Note: Other categories omitted because of low frequency or unsystematic reporting.
TABLE 8-1
Final Results of the Constituent Assembly Election of 28 March 19821
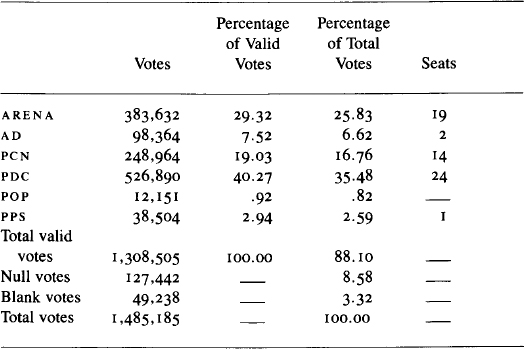
Source: Computed from U.S. Department of State, Foreign Broadcast Information Service, VI, Central America, 2 Apr. 1982, 1.
TABLE 8-2
Approximate Distribution of the Vote in the Constituent Assembly Election of 28 March 1982, by Department
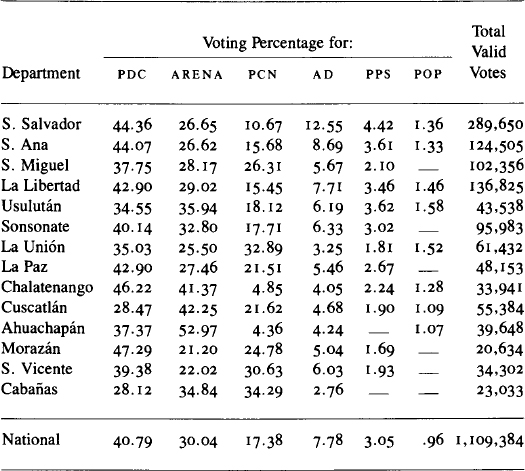
Source: Computed from U.S. Department of State, Foreign Broadcast Information Service, VI, Central America, I Apr. 1982, pp. 1–2.
TABLE 8-3
Cooperatives Organized under Phase I of the Agrarian Reform, December 1981
| Department | Number of Cooperatives | Total Area | Number Abandoned |
|---|---|---|---|
| Ahuachapan | 27 | 21,174 | — |
| Santa Ana | 28 | 27,669 | 3 |
| Sonsonate | 34 | 42,424 | — |
| La Libertad | 54 | 56,167 | 4 |
| Chalatenango | 9 | 10,846 | 1 |
| San Salvador | 14 | 19.399 | 2 |
| Cuscatlan | 3 | 4,923 | 1 |
| La Paz | 43 | 37,426 | 3 |
| Cabanas | 2 | 1,042 | |
| San Vicente | 27 | 24,486 | 9 |
| Usulutan | 46 | 40,280 | 7 |
| San Miguel | 20 | 28,864 | 1 |
| Morazan | 2 | 1,856 | — |
| La Union | 17 | 23,120 | 1 |
| Unknown location | — | — | 35 |
Source: Proceso, 2, 55 (1–7 March 1982), p. 8, from Pecchi and Company, Agrarian Reform in El Salvador. Study presented to the Agency for International Development, Washington, D.C, December 1981.
Note: All areas are in manzanas. One manzana is equal to approximately 17 acres. Land area abandoned refers to the land affected by the Reform, turned over to cooperatives and then abandoned by the cooperativists for lack of credit or other difficulties. Percent abandoned refers to the cooperatives abandoned as a percent of all cooperatives. Percent, area abandoned is the proportion of the land affected by the Reform which has now been abandoned.
| Land Area Abandoned | Percent Abandoned | Percent, Area Abandoned |
|---|---|---|
| — | — | — |
| 1,243 | 10.7 | 4.5 |
| — | — | — |
| 3.320 | 7.4 | 5.9 |
| 3,288 | 11.1 | 30.3 |
| 2,863 | 14.1 | 14.7 |
| 439 | 33.3 | 8.9 |
| 2,165 | 6.9 | 5.8 |
| — | — | — |
| 5,036 | 33.0 | 20.6 |
| 5,530 | 152 | 13.7 |
| 831 | 5.0 | 3.0 |
| — | — | — |
| 2,056 | 5.9 | 8.9 |
| 27,897 | — | — |